Vibrations of MgO crystal


Vibrations of MgO crystal

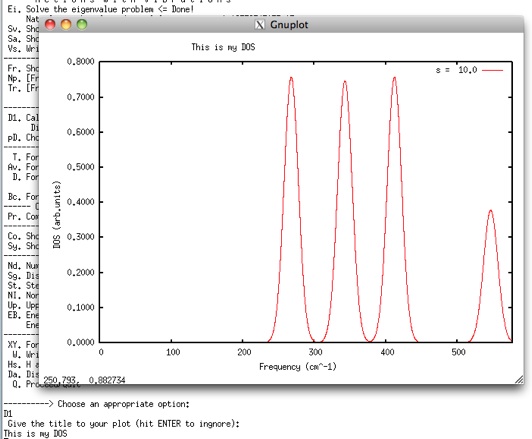
23. One can also have a look at the vibrational DOS. This is done simply by representing each phonon frequency with a Gaussian, so that a sum of such Gaussians centred at their frequencies is plotted. Dispersion is in Sg. Type D1, give a title for the plot (e.g. “This is my DOS”), and a gnuplot window pops up with the plot, below:
24. It is possible to choose the best dispersion for the Gaussians by changing it in Sg. However, the best way is to try several different dispersions and plot all the corresponding DOS curves at the same time. Use Nd to specify 3 dispersions; under Sg default values are displayed:
Note that this is not a very good phonon DOS as we do not have enough k-points, this is just an illustration!
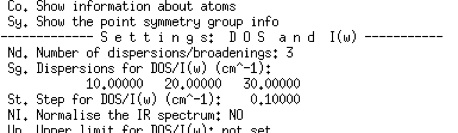
You can change them using Sg, but let us keep these default values here.
25. Now type D1 followed by the title (“this is my plot”) and will get this:
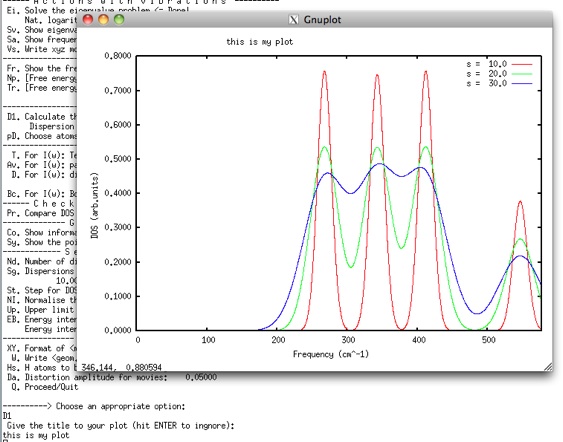
Three curves for the DOS are displayed simultaneously corresponding to the three dispersion values: 10.0, 20.0 and 30.0 cm-1.