Some possible
projects are listed below.
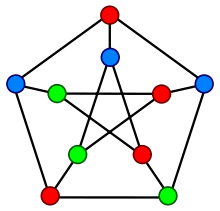
[CC01] Graph
colouring games.
The aim is to
colour the vertices of a graph so that no two adjacent vertices
have the same colour. An example of such a
colouring is given here.
The plan is to
use as few distinct colours as possible and,
if possible use each colour the same number of
times.
Although many
heuristic algorithms exist for this problem, finding a best solution
(minimum number of colours) is difficult, especially when the
graph is large.
The project would
be to write an interactive program allowing input of (quite large) graphs to a
GUI,
probably as input from file as this is not primarily
a graph drawing project.
The GUI should be
arranged in such a way that the user can easily try out colourings the graph;
hopefully with a small number of colours. The program
could then score the user a
gainst the best selection it could find, or suggest
improvements; or alternatively
the user could try to find an improvement on the
solution offered by the program.
To improve on
this simple sounding problem you could make your adversary your computer
which plays alternative moves with you and tries
to make you to use
more colours than you need.
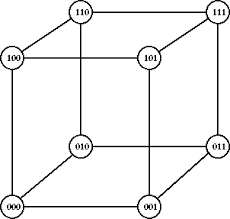
Here is a simple
example. For cubical graph (given here) two colours are enough.
If you colour the
bottom left vertex blue, and the computer then colours the bottom right
vertex blue you will need at least 3 colours.
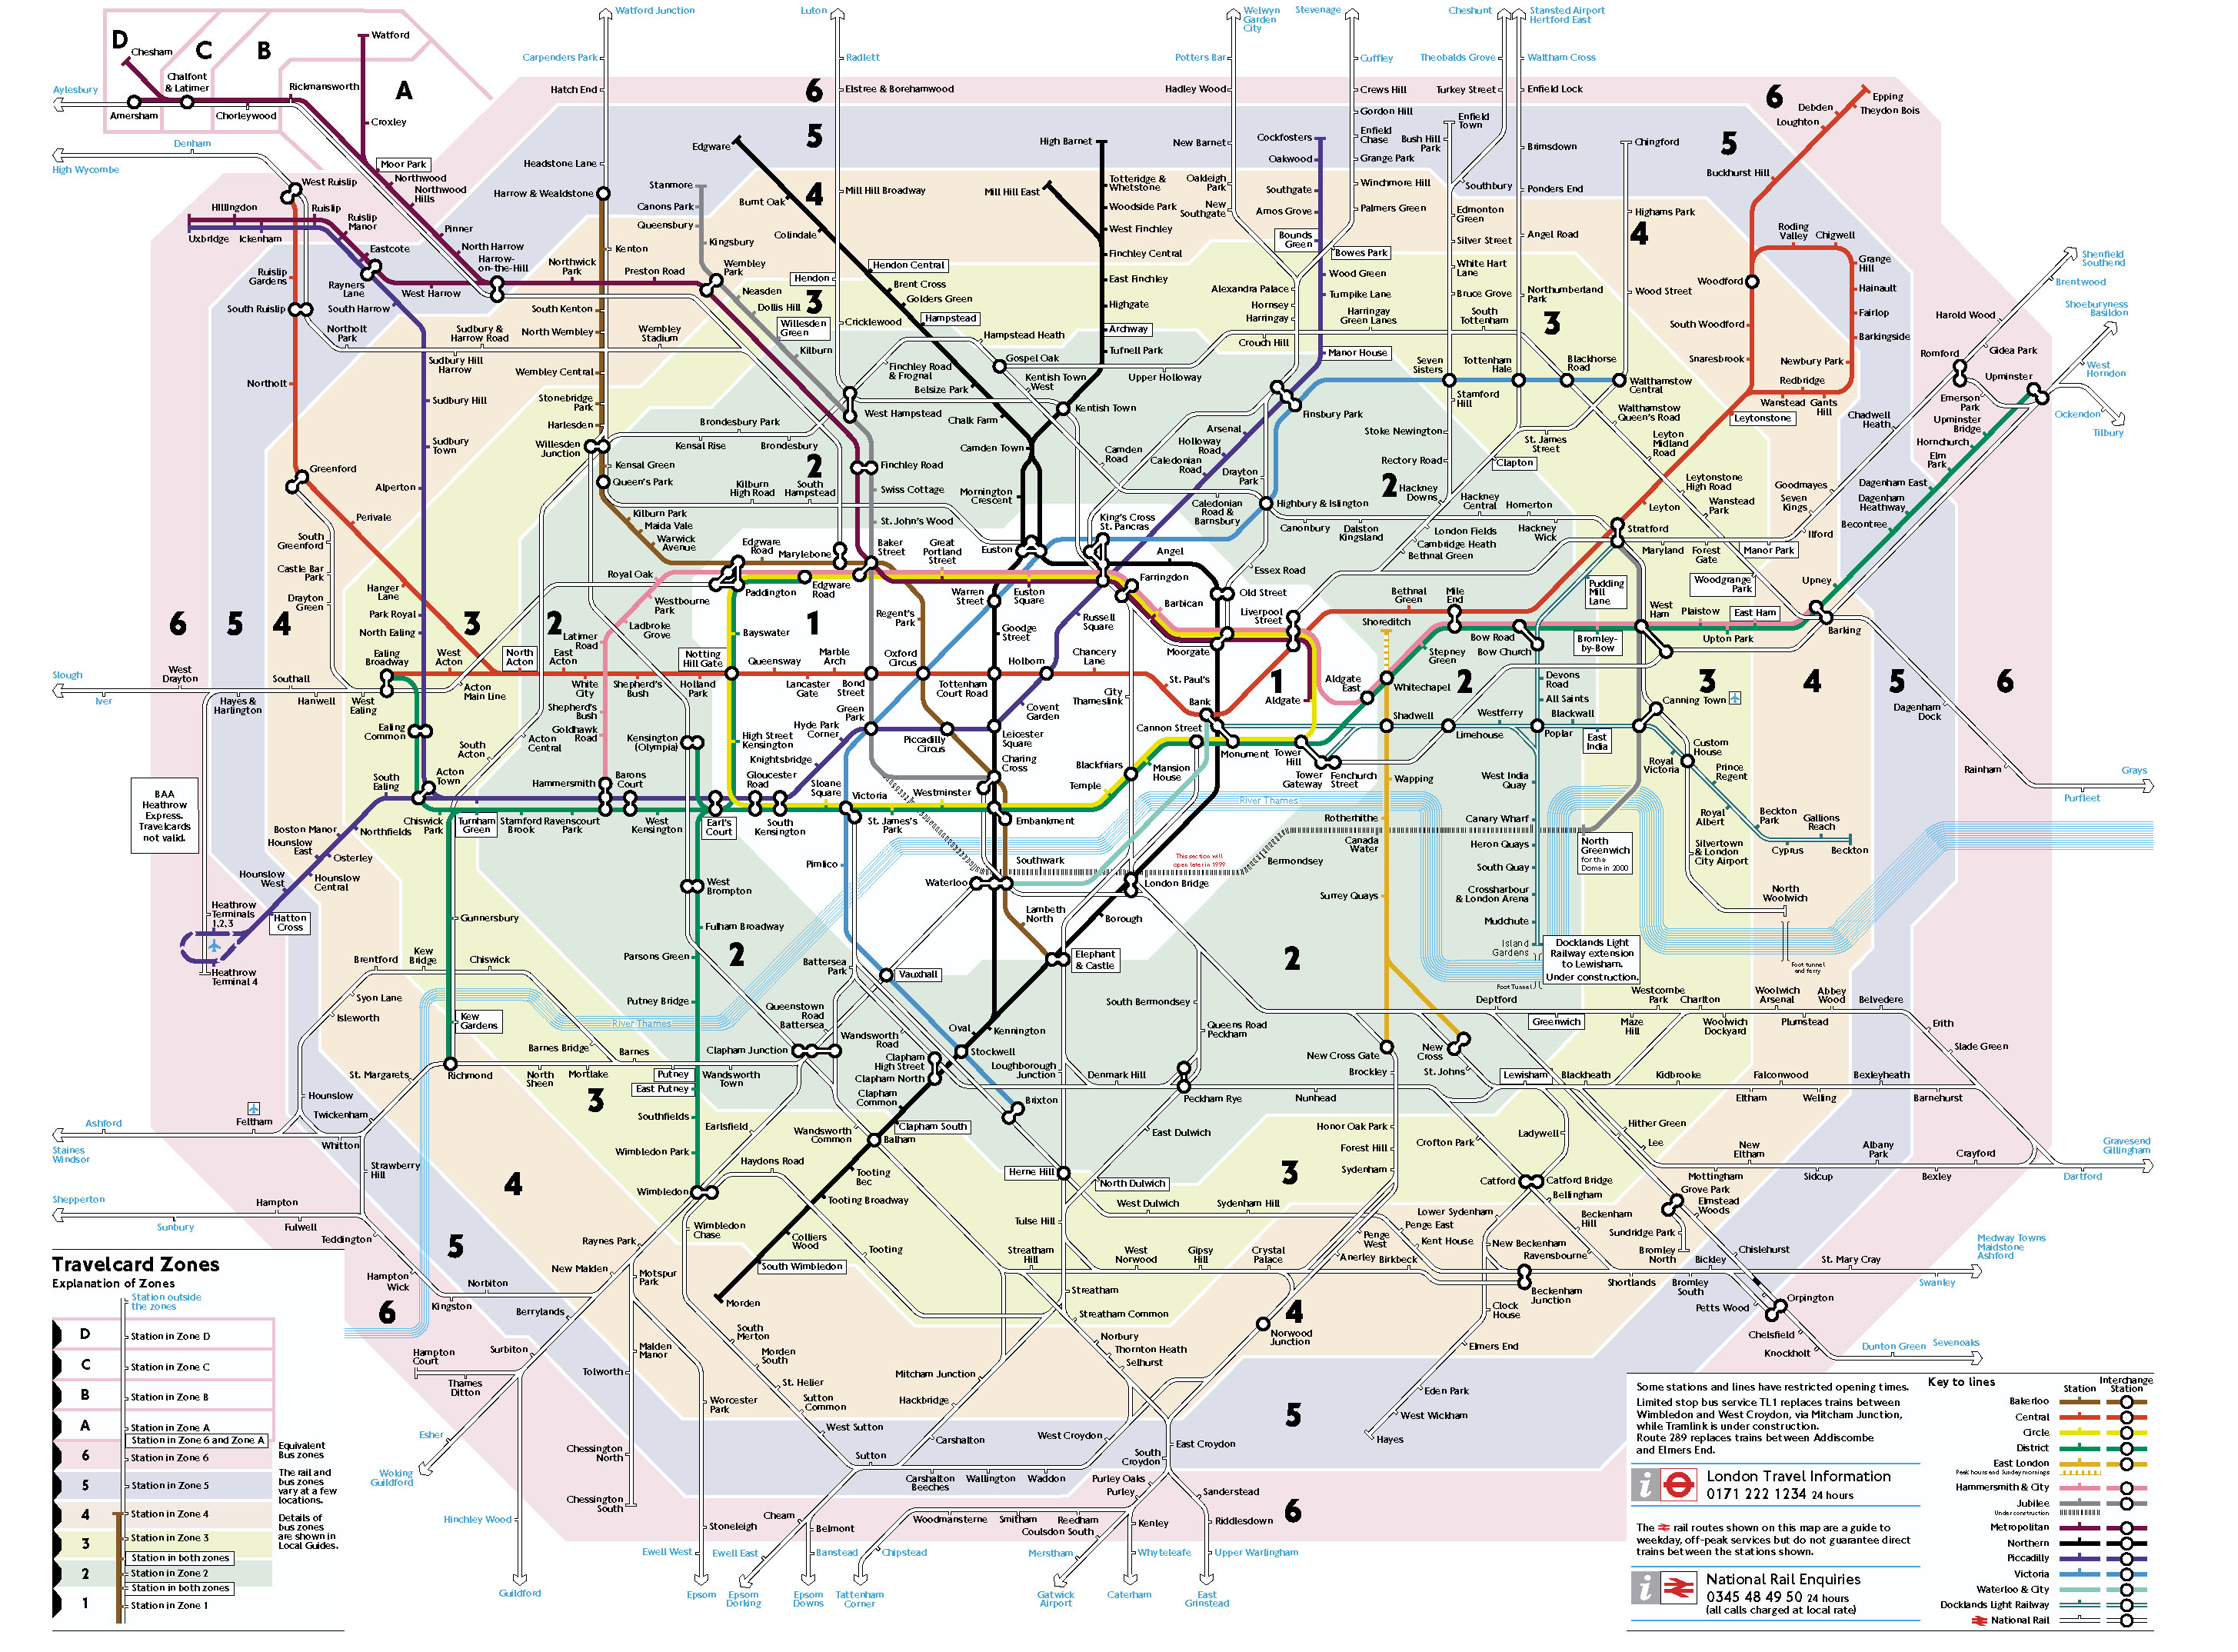
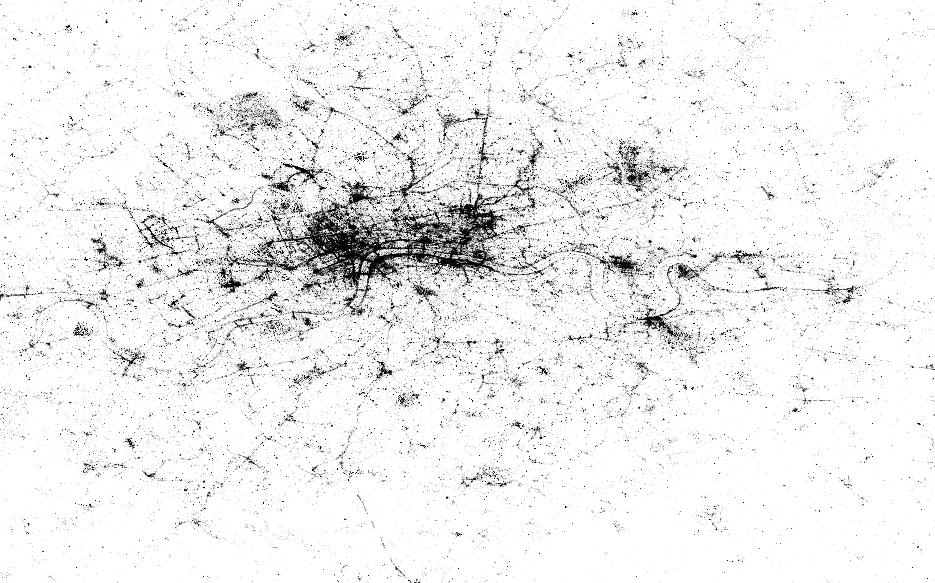
[CC02] Improving a transport network.
A typical
transport network (here) can be
improved by adding new
links (here).
This is an expensive process and careful planning is needed.
Usually the
number of passengers who travel between each pair of
stations is known (origin-destination data), and
this is one use for Oyster cards.
In this way the
effect of improvements can be measured in details.
A price is
attached to travel time, and also to the number of interchanges.
This is balanced
against the cost of link construction.
The project would
be to take an existing network, and suggest new links, or measure the congestion
arising from removing links.
[CC03] The friends European holiday schedule
The problem is
described below.
In essence it is
a constrained version of the TSP (traveling salesperson problem) and
captures many of the difficulties of scheduling large
fleets of delivery vehicles
A group of
friends have a week to travel round Europe.
They want to
visit as many places as possible between them.
The number of
places which can be visited in a week is
limited by the travel time between them and the time
spent there
sightseeing, plus time lost eating sleeping etc.
The friends make
individual schedules with the aim that each sees as
much as possible, and that between them the total
number of places visited is as large as possible.
Added to this
there may be constraints, such as everybody wants to visit as
many countries as possible. Also there may be
personal themes such as visiting
famous museums; which means that opening times have
to be taken into account.
Thus each friend
may give each city an importance weighting.
Because they are
friends, each person would like to meet up pairwise with as
many others as possible at some stage or other
during their travels.
On the other hand
everybody would like to see some different things so that they can talk about
it.
The project would
be to produce a s/w package to produce feasible
schedules,
quite possibly with an interactive interface to
allow changes/improvements,
and a graphical output of the schedules
embedded in the map of Europe.
Needless to say
the algorithmic side is also important.
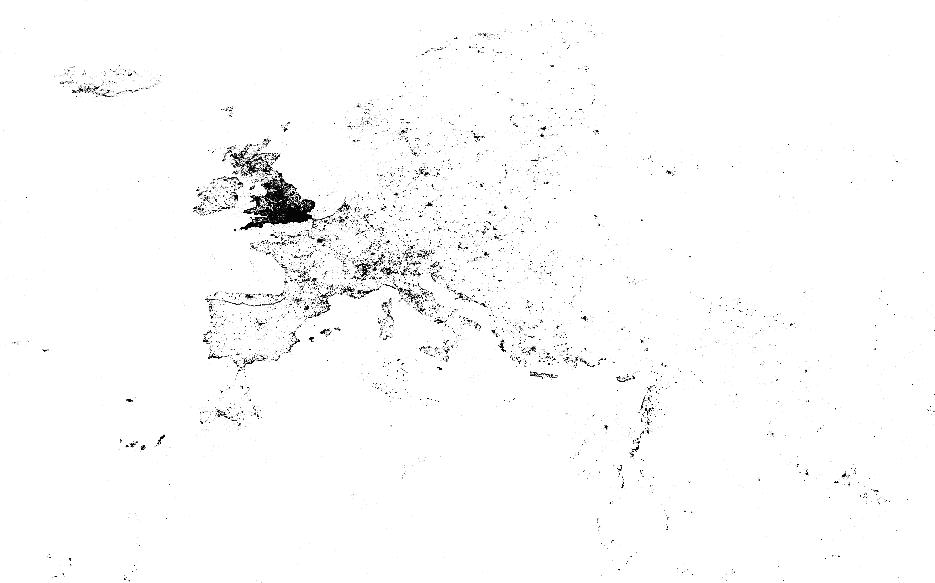
[CC04] Join up
the dots to make a city map.
Photographs
posted on Flickr contain metadata giving geographic
coordinates, topic, time photo was taken etc. This was
used in a research
paper to
decide the most popular location/building in the
capital cities of the world.
The coordinates
of photos taken by people belonging to a
particular interest group in Flickr are shown here.
No doubt you
recognise where this is from the dots, but the question is how to turn this
into
something useful. For example:
to aggregate dots to produce markers for
popular location (Trafalgar Square,
Houses of Parliament),
To extract
information for tourist use (locations of most popular landmarks),
to simplify the data to sketch in some outline
roads, bridges, popular spaces and so on,
or even just find the boundaries of
the land masses.
The London
meta-data would be available to you as part of the project.
[CC05] Visual interface
for generalized Euler tours and problems in
wiring
and stitching patterns.
The Euler tour problem
is how to traverse all edges of a graph exactly
once and get back to where you started, without using any edge twice.
Continuous wiring
electrical circuits, or stitching designs on
a flat surface
can be viewed as an adapted Euler tour problem.
An example: The letters (TIN) can be viewed as a 7 edge, 10
vertex
graph consisting of 3 components:
T: 4 vertices, 3
edges [there is a vertex at the T-junction]
I: 2 vertices, 1
edge
N: 4 vertices, 3
edges
In terms of an Euler
tour, the graph needs additional edges
inserting to join up the letters to make a figure which can be
drawn without taking the pen off the paper.
If you regard the T, I,
N as electrical components (neon lights for example),
the additional wiring (or glass tube) needs to go on the back of the
board,
or on the front of the board avoiding the letters.
The wiring needs to be
as short as
possible to minimize assembly costs, and must not cross.
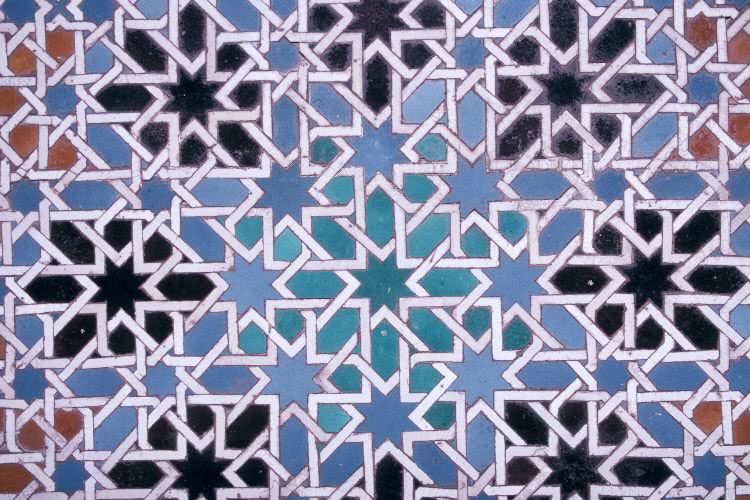
[CC06] Interactively creating tile designs.
Many tile
designs, for example this one from
the Alhambra in Granada, Spain
seem to be based on a grid of ruled lines
(horizontal, vertical, diagonal sloping right and left at 45
degrees),
with some systematic rule for line removal
The project aims
to write a program to draw such patterns and to generalize them.
One major problem
is to decide which line segments should go over/under which at each
intersection.
Perhaps a mixture
of an interactive GUI and an algorithmic approach might work.
Another feature
could be to input the pattern and to automatically dissect
it into parts which can be assembled into
panels to show the components of the pattern.
These could then
be analysed etc.
[CC07] Finding web
communities
A java program (java.net API) to crawl from
page to page in the www and use the results to build a network model of the
pages and their links. This would then be used to identify web
communities; i.e. pages which share common topics, and whose linkages are
denser than might be expected.
There are quite a lot of heuristics to find community structures
in networks, e.g.
http://en.wikipedia.org/wiki/Community_structure
The project seeks to augment the concept of community based on
graph structure by adding extra edges based on similarity of text within
documents. So crawling from an initial query such as “Politics of the United
States” might try to include Republican sites in one group and Democrats in
another. In any case it would filter out sites such as doubleclick.net and
distinguish the political reporting from other news articles which were
retrieved.
This could be used to draw draw a site
map of various pages which are linked (at some distance) by common text content
(Clinton, Trump) or interest. (Have a look at Touchgraph to get some
sort of idea). An initial guess on how
to do this might be to automatically download the responses to a Google query
and crawling to a fixed depth from there. Use this as the input data.
[CC08] Using
random walks to find shapes in images.
An image is a
collection of pixels each with a colour
attribute. Each pixel apart from the edges of the
photo has 4
neighbours (2 vertical pixels, 2 horizontal).
The strength of
an edge between neighbouring pixels in the graph
model of the photo depends on how similar the
colour attributes are
(edge strength). The problem is to use this information to
separate
the main different coloured shapes in the photo.
For example, it
should be possible to pick out the white background
of the face in this figure.
The approach to be
investigated in this project is the possibility of using
short random walks, to segment the image. The
walks move from pixel to pixel randomly,
but depending on the
edge strength (colour similarity). By repeated sampling
it should be possible to superimpose the shapes
found to get something meaningful.
In real life this
problem has to do with medical imaging: automatic
boundary drawing around body parts in a scan. So an
interesting
problem would be to add an extra shape to the
figure, and see if
your software can diagnose the inserted shape (tumor).